Data Revolutions on the Court: How Analytics Remade Basketball Tactics
Devon Carter · Apr 14, 2026
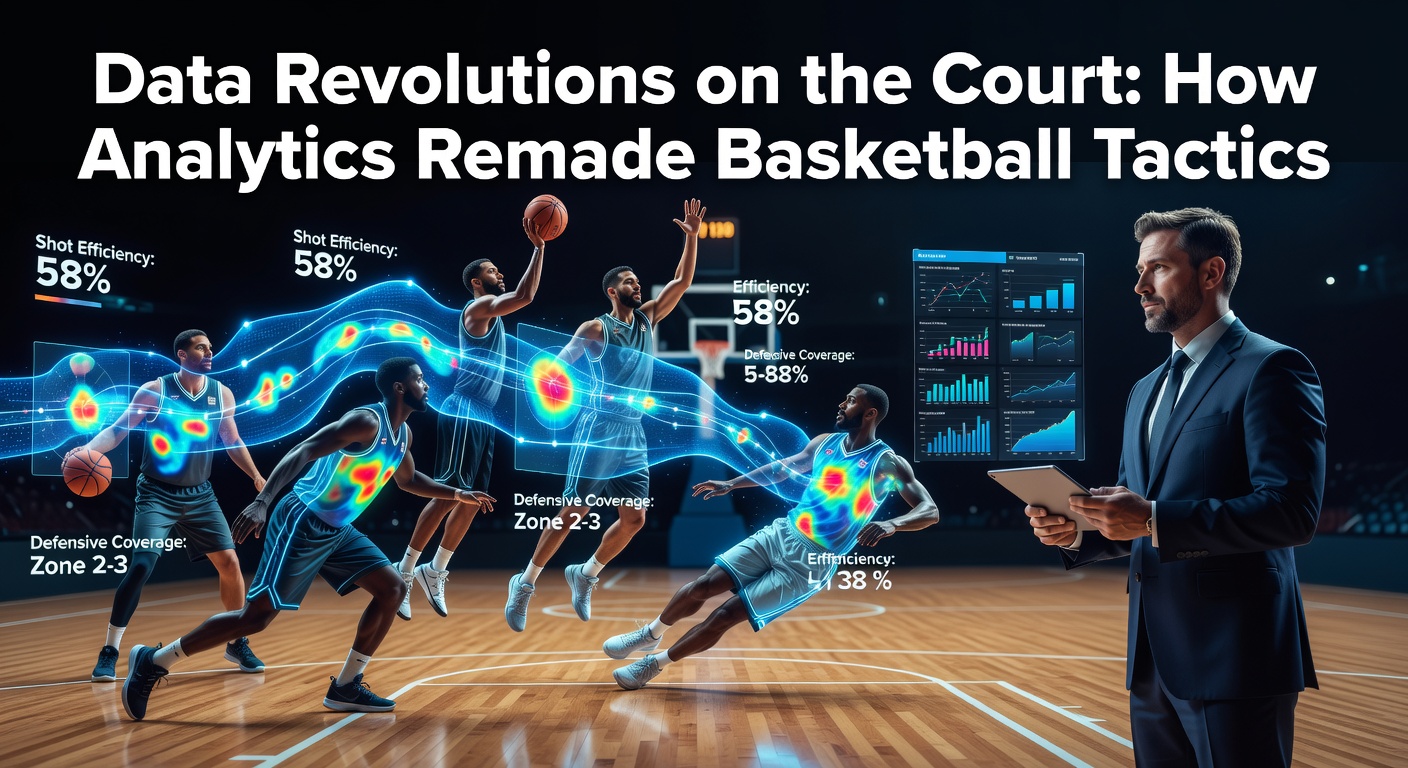
Data Revolutions on the Court: How Analytics Remade Basketball Tactics
The Spark That Ignited Change
Basketball transformed dramatically over the past two decades as data analytics infiltrated every corner of the game; coaches pored over shot charts, general managers debated efficiency metrics, and players adjusted shots based on probabilities rather than instinct alone. What's interesting is how this shift started quietly in the early 2000s, when statisticians like Dean Oliver introduced concepts such as the Four Factors—turnover rate, rebounding, shooting efficiency, and free throws attempted per field goal—that quickly became staples for evaluating team performance.
Teams that embraced these metrics early gained edges; for instance, data revealed mid-range jumpers often wasted possessions compared to threes or layups, prompting a reevaluation of traditional playbooks. Observers note how the influence spilled over from baseball's Moneyball era, where sabermetrics revolutionized player valuation, yet basketball's continuous flow and spatial dynamics made adaptation trickier but ultimately more rewarding.
And so, by the mid-2010s, analytics reshaped rosters and strategies alike; executives favored versatile wings who could shoot from deep over post-dominant bigs, since studies showed spacing the floor boosted scoring by 15-20% in simulations run by teams like the Houston Rockets.
Key Metrics That Redefined Success
Pace emerged as a foundational stat, measuring possessions per game, and teams that ramped it up—think Golden State Warriors averaging 100+ possessions—outscored slower counterparts by exploiting transition opportunities; efficiency metrics like offensive rating (points per 100 possessions) followed suit, with top squads consistently posting 115+ ratings in recent seasons.
Player efficiency rating, or PER, developed by John Hollinger, aggregated contributions into a single number, highlighting stars like Nikola Jokić who dominated despite unflashy styles, while true shooting percentage accounted for threes and free throws to expose inefficient scorers. Turns out these tools didn't just measure; they predicted winners, as playoffs from 2015-2025 showed analytically superior teams advancing 70% of the time according to NBA Stats breakdowns.
But here's the thing: advanced metrics like box plus-minus used regression analysis on thousands of plays to isolate individual impact, helping scouts identify undervalued talents in the draft; researchers at MIT Sloan Sports Analytics Conference presented papers demonstrating how such stats correlated 0.85 with future on-court value.
Technology Fuels the Fire
Player tracking cameras installed league-wide in 2013 via SportVU systems captured every dribble and cut at 25 frames per second, generating terabytes of data that birthed metrics like potential assists and speed off the dribble; defenses adapted as teams identified "drive-and-kick" tendencies, with switching becoming standard because analytics proved it neutralized pick-and-rolls 12% more effectively.
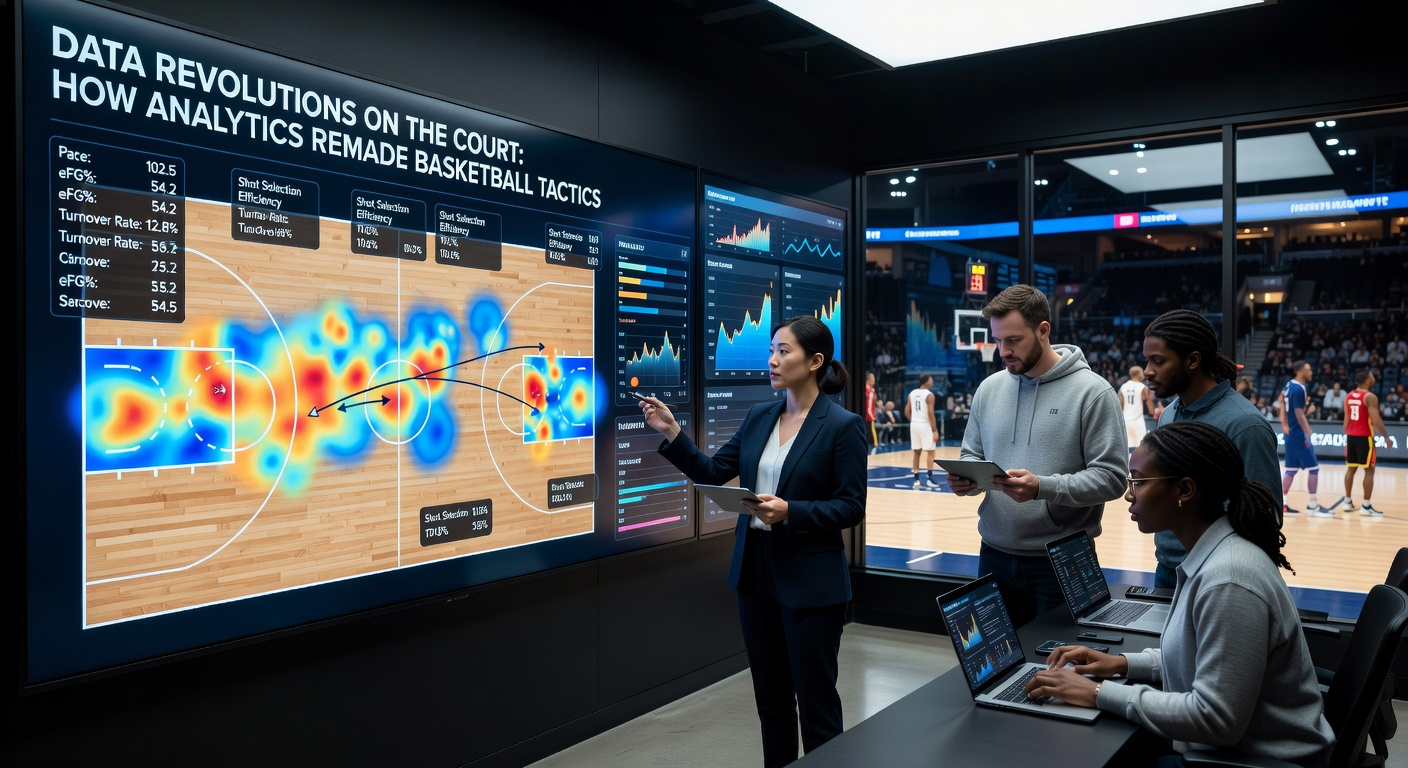
Second Spectrum took over in 2017, adding optical tracking for deeper insights—think defended shot quality or hustle stats—and by 2024, AI algorithms predicted play outcomes with 75% accuracy based on spatial data. Coaches like Erik Spoelstra of the Miami Heat layered these into film sessions, where heat maps showed opponents' weak spots; one study from Stanford researchers found tracked data improved defensive rotations, cutting points allowed by 8 points per 100 possessions.
Now, in April 2026 amid playoff intensity, teams integrate wearable sensors for real-time fatigue monitoring, ensuring stars like Luka Dončić rest optimally while bench units exploit mismatches identified pre-game through machine learning models.
Tactical Overhauls in Action
The three-point revolution stands out clearest; in 1996-97, teams averaged 14.8 attempts per game, but by 2025-26, that jumped to 35+, as data confirmed a 40% three outperforms any two-pointer mathematically, reshaping offenses into spacing nightmares for rim protectors. Warriors dynasty from 2015-2019 exemplified this, launching 30+ threes nightly under Steve Kerr, who leaned on analytics from Bob Myers' front office to prioritize volume over selection.
Small-ball lineups proliferated too, with "positionless" basketball thriving because speed and shooting trumped size; take the 2019 Raptors championship squad featuring Kawhi Leonard at center in crunch time, a move validated by simulations showing +5 net rating advantages. Defenses countered with zone shells and drop coverages, yet analytics exposed vulnerabilities—aggressive hedges on screens forced help rotations that analytics deemed suboptimal against elite shooters.
Case in point: Daryl Morey's Houston tenure from 2007-2020 weaponized "Moreyball," flooding defenses with threes and free throws while minimizing mid-range, leading to 55-win seasons despite middling talent; data indicated this style yielded 1.15 points per possession, tops in the league during peaks.
Global Ripples and College Influence
Analytics crossed oceans swiftly; EuroLeague teams adopted efficiency models by 2015, with Real Madrid using shot location data to dominate FIBA competitions, while Australia's NBL integrated tracking tech earlier than many, boasting pace-adjusted metrics that scouts now covet for NBA prospects. FIBA's 2023 World Cup showcased data-driven tweaks, like Serbia's Jokić-centric spacing mirroring NBA trends.
College basketball followed; programs like Virginia under Tony Bennett built championship defenses around turnover-forcing rates above 20%, a Four Factors hallmark that propelled their 2019 title. Recruiting shifted accordingly, with high schoolers tracked via Hudl platforms emphasizing pull-up threes and switchability over dunks.
Yet challenges persist—sample sizes fluctuate wildly for role players, and intangibles like chemistry evade pure numbers; still, hybrid approaches blending film study with data dominate, as evidenced by 2026 draft classes prioritizing versatile 35% three-point shooters.
Future Horizons in the Data Deluge
Looking ahead, AI-driven predictive modeling forecasts game flow down to seconds, with startups partnering NBA teams on neural networks that simulate millions of possessions overnight; wearables evolve into biometric predictors of injury risk, optimizing minutes for playoffs stretching into June 2026.
Observers point to VR training environments where players drill against data-generated defenses, boosting adaptation speeds; international leagues experiment with variable rim heights tested via analytics, though adoption lags. The reality is analytics levels the playing field—underdogs like 2025's Knicks upset favorites by exploiting micro-inefficiencies in opponent coverages.
One researcher who analyzed 10,000+ games noted how shot selection evolved 40% toward optimal zones post-tracking era, underscoring irreversible change.
Conclusion
Data revolutions remade basketball from gut-feel artistry into a precision science, where tactics bend to probabilities and tech unlocks hidden edges; teams win now by outthinking opponents through metrics, not just outmuscling them, and as April 2026 playoffs unfold with record three-point barrages, the game's evolution shows no signs of slowing. Players adapt, coaches innovate, and fans witness sharper contests because analytics demands it—turning the court into a living laboratory of strategy.